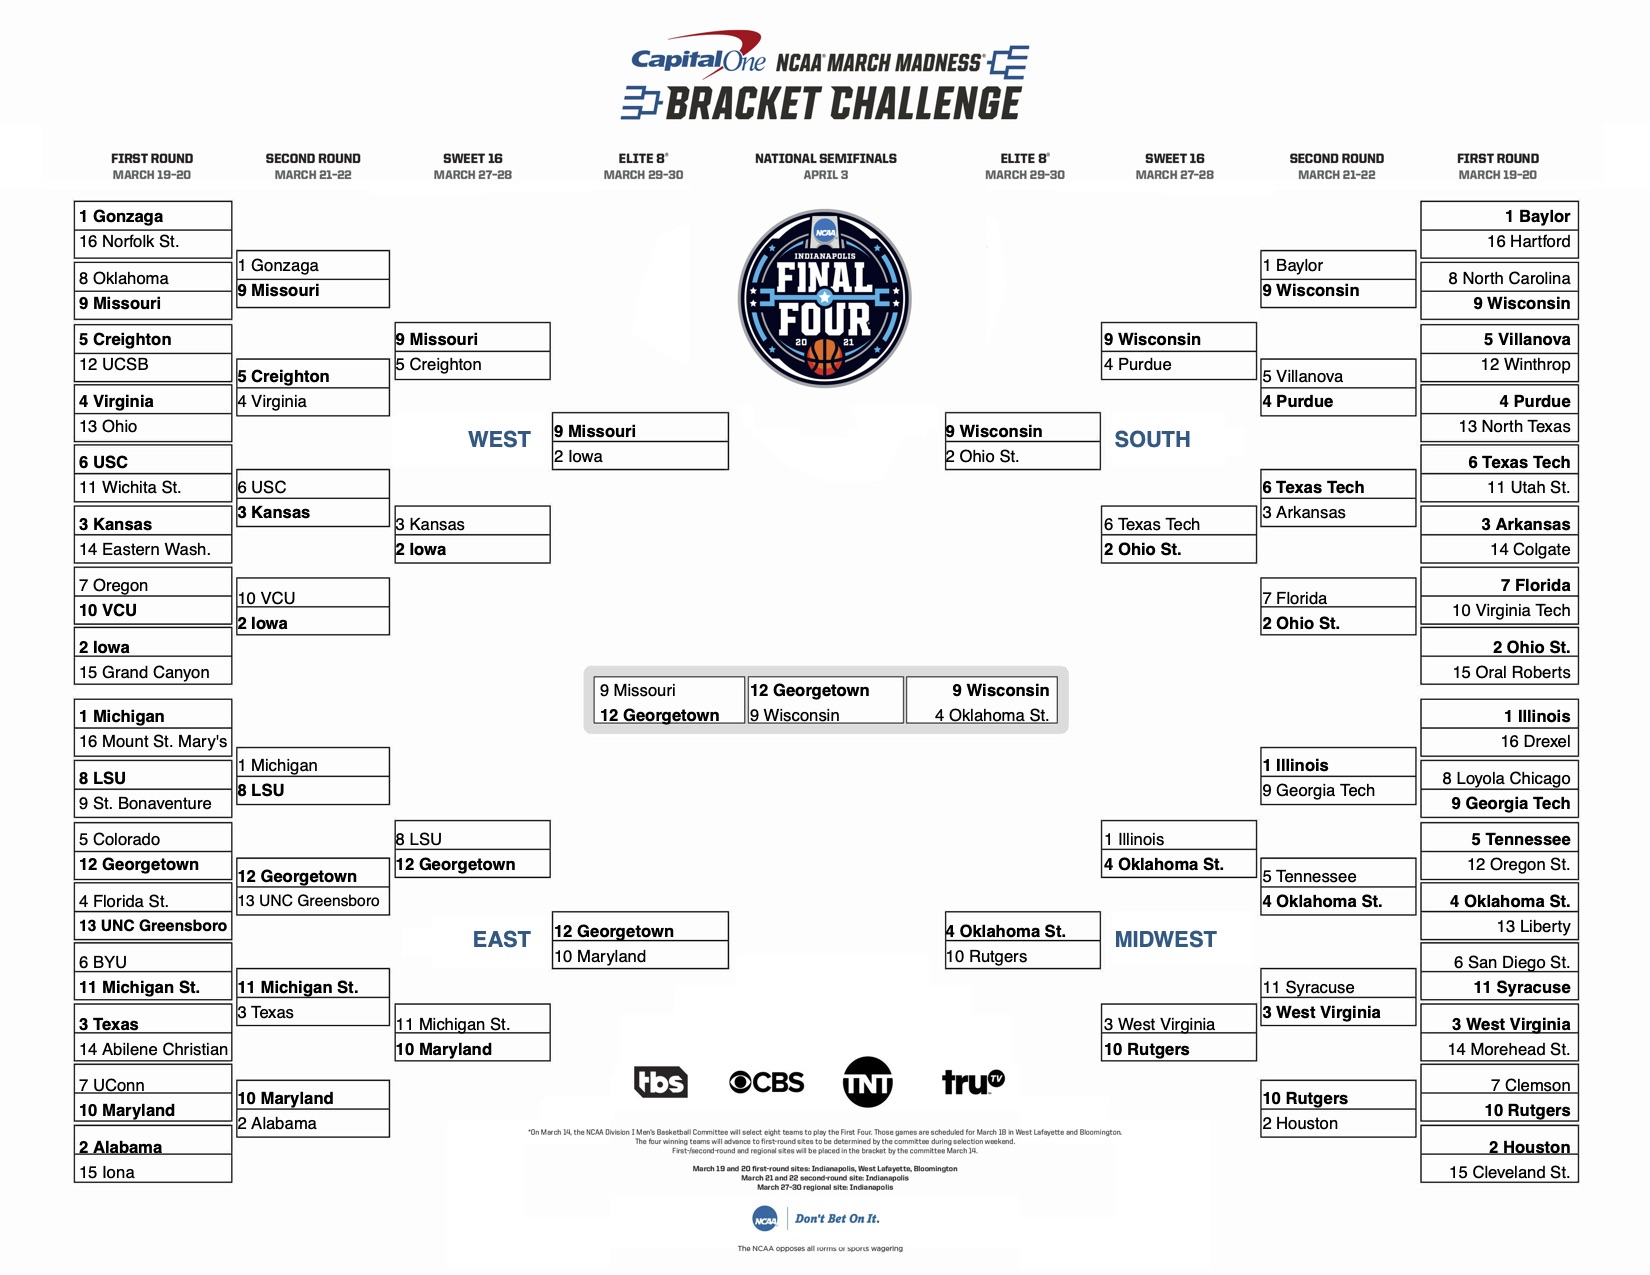
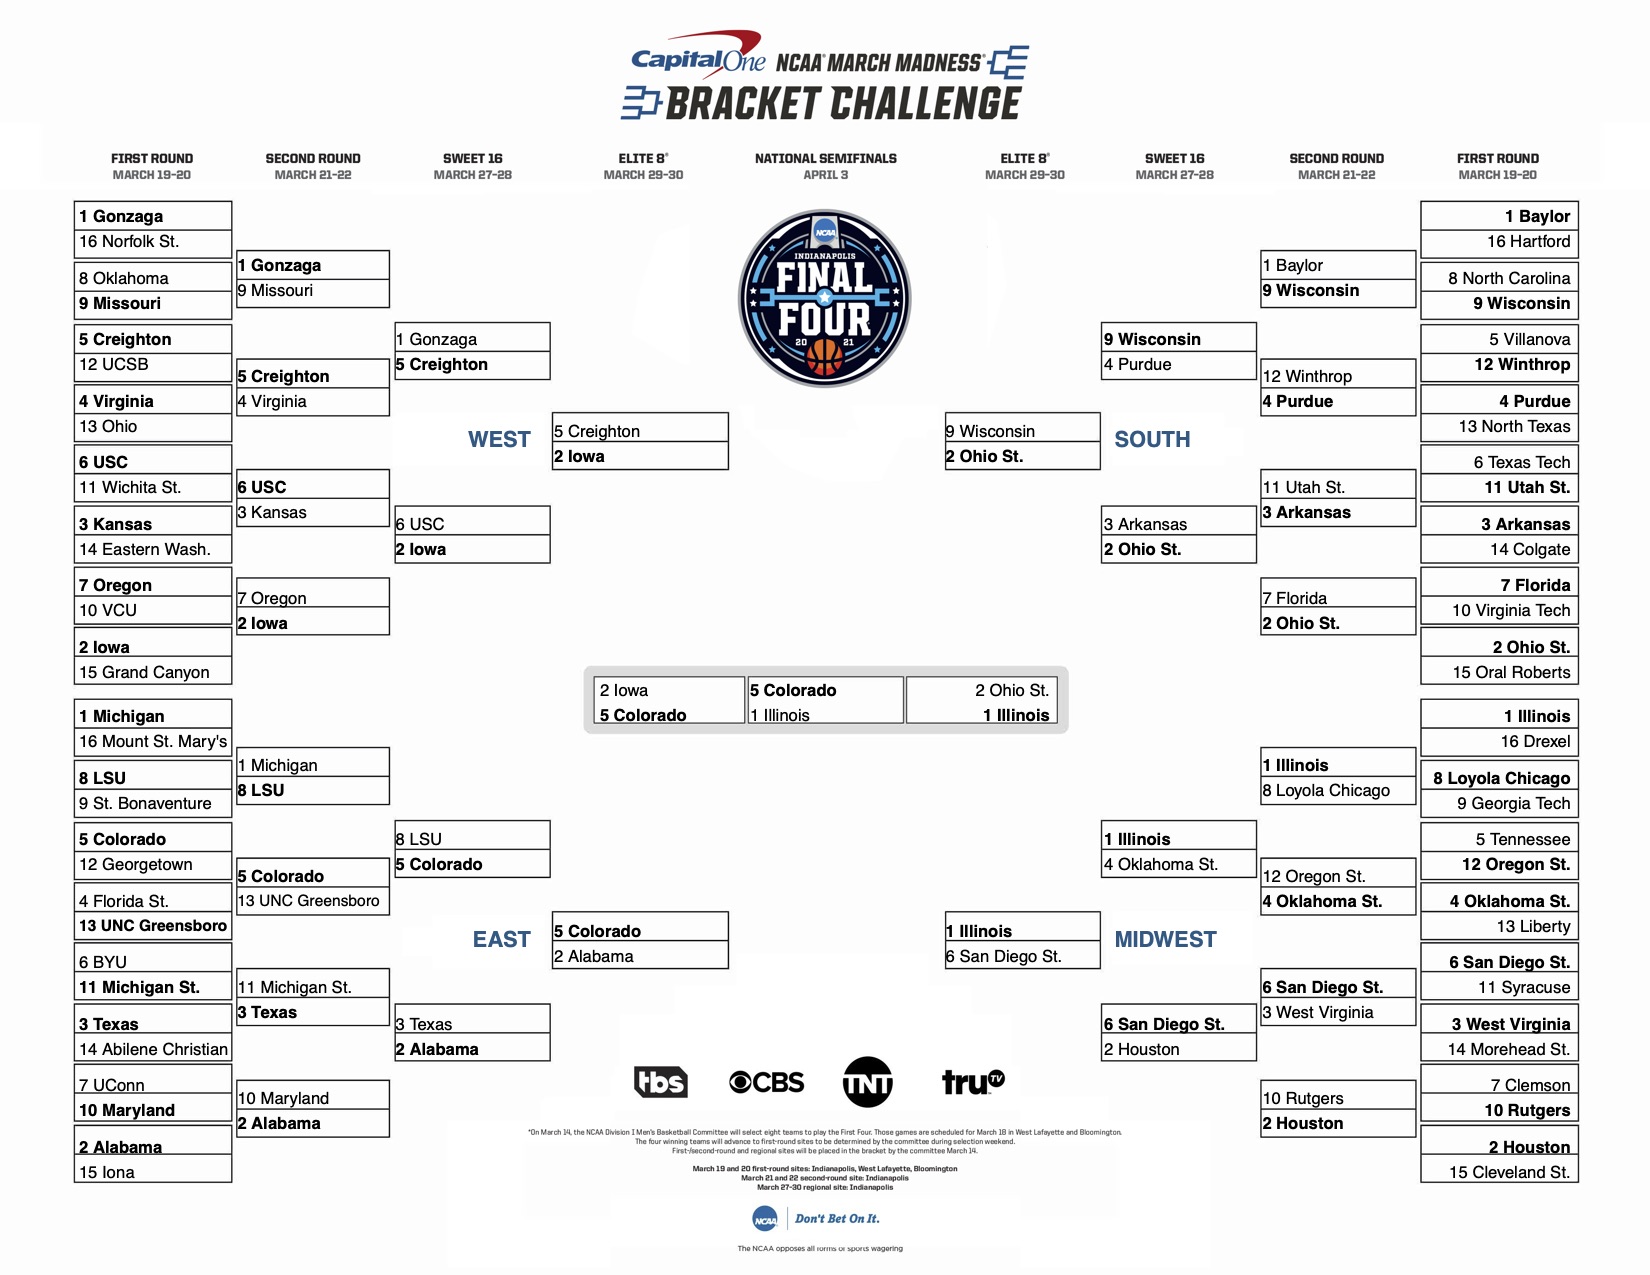
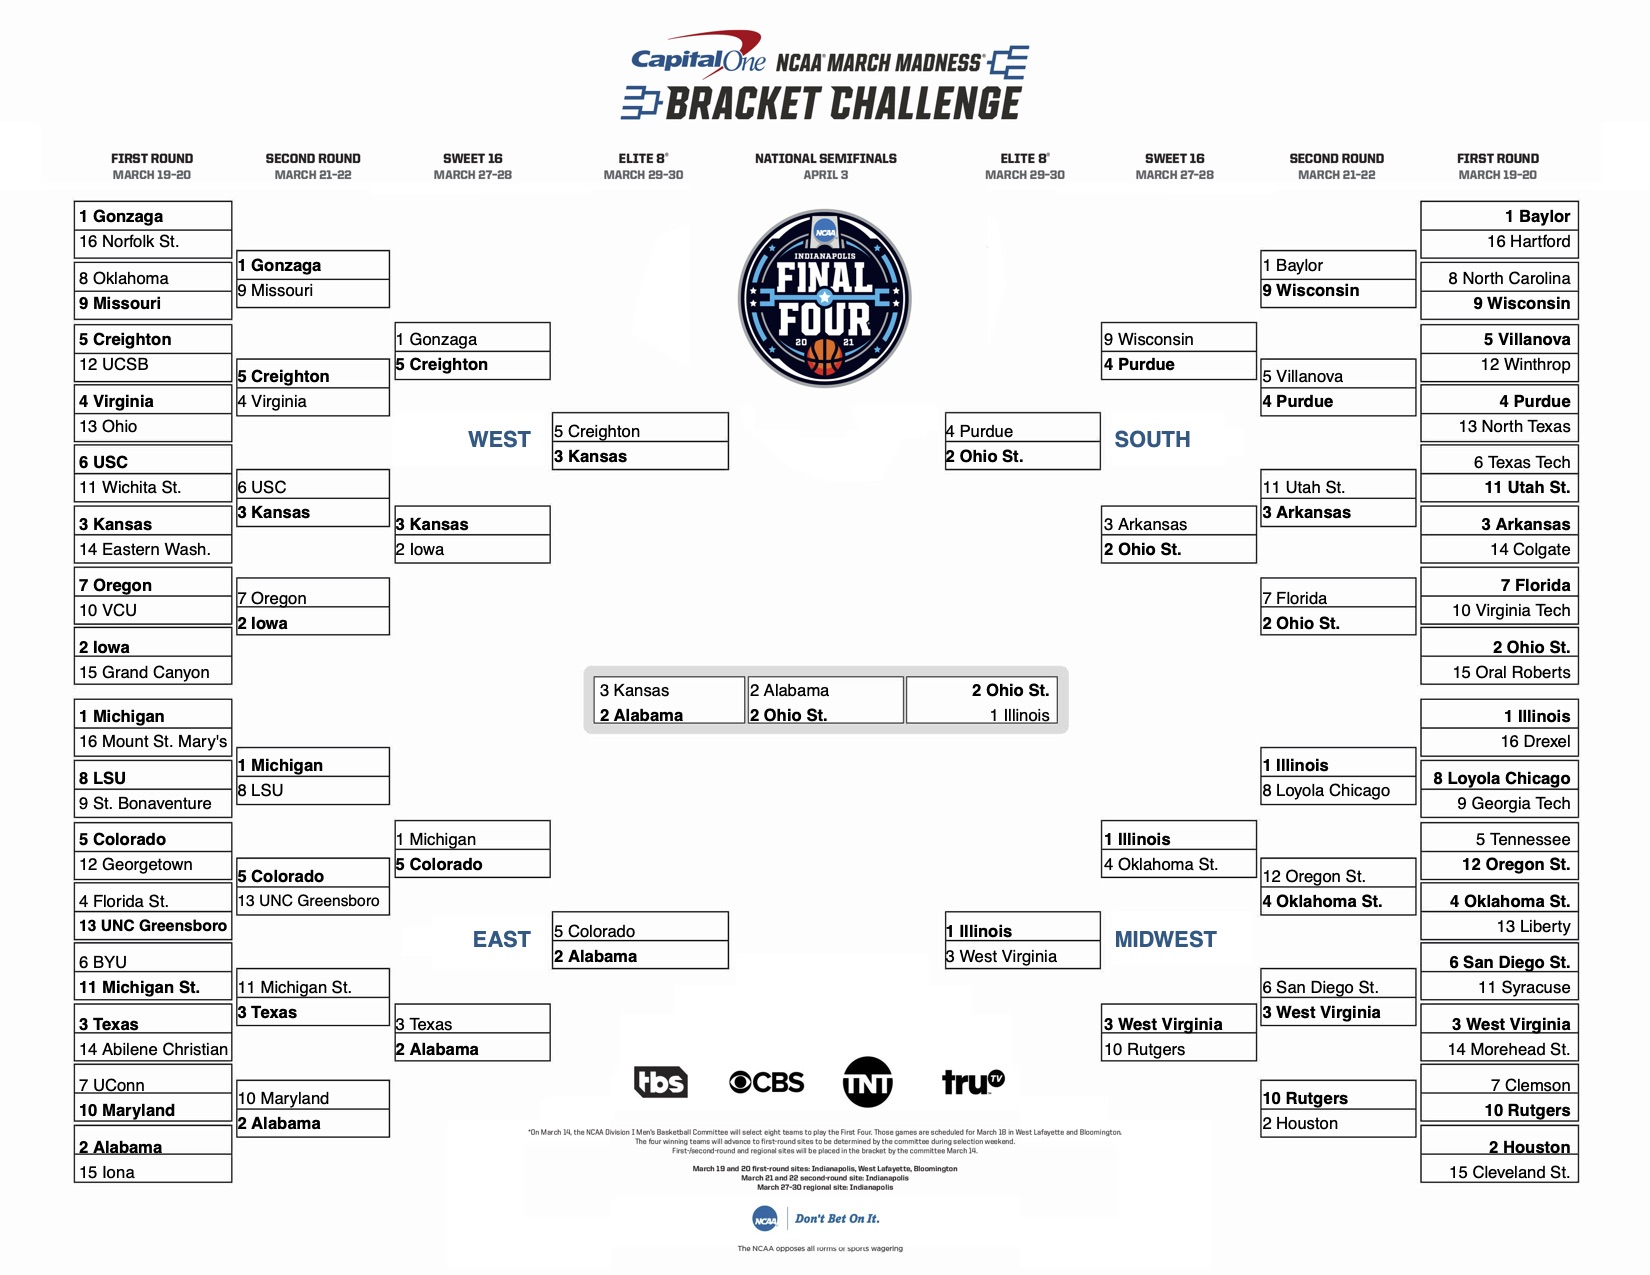
Mark Mueller, a 2020 Math alumnus stopped by campus to show us how he used regression analysis to pick three different March Madness brackets. The similarities were interesting, but the differences even more so.
Simply put, regression analysis is a mathematical way to find trends in data.
Mueller, who did a senior capstone project on NBA playoff teams, found relations between each NBA team’s statistics to create a predictive model to calculate which teams would make it furthest in the playoffs.
For this project, he started out with 36 different variables for the college basketball teams.
Mueller used statistical information on how the teams did in the 2017, 2018 and 2019 NCAA tournaments. Some of those stats included: field goals made, free throws made, rank, region rank, minutes played, home wins, home losses and several more.
All 36 variables were used in his first bracket, the raw regression model. From there he broke it down into a significant model bracket, using 11 significant variables from the raw regression model. His third and final bracket, the adjusted regression model, was built with only the six variables with the highest individual correlation to rounds won in the tournament.
Check out our video with Mark, to see the results and similarities between the brackets and what he recommends to use to choose your bracket if you want to do it mathematically.
We’ll be following the tournament to see which brackets stand up to Mark’s regression analysis. Be sure to follow along on our social media accounts (@iupuiscience) for updates after each round. We’ll update this story after the championship game!
Description of the video:
Rounds won is kind of what I wanted to predict. So, depending on if they made it to the finals that they would have won five rounds to make it that far. They won the championship, they won six rounds essentially. So, each time you win a round, you get one round one 'so that's kind of like a starting point on why I want to predict in the end game. So, I took all 36 variables and use that to calculate round one, the prediction. It was, I mean it was very surprising Georgetown was the winner predicted winner. It's also interesting to note with using all of these, not a single one seed made it to the elite 8. Took the raw regression model and slimmed it down to just the most significant. Predicted winner was Colorado, which I said was interesting because Colorado and Georgetown played each other and then the winner, the match-up two of the three models were the winner of the tournament. So, the adjusted regression are the variables that have the highest singular correlation to rounds won. So, if you look at them individually, they have the highest correlation to rounds won. So, it took all those and put them all, adjust to just those six statistics. Again, it was kind of interesting. No one seed won, but, Ohio State was the predicted winner. In all three models, Wisconsin beats U-N-C in the first round. Maryland beats out U-Conn in all three brackets as well. Rutgers beats out Clemson and all three brackets. So just little upsets like that's kind of interesting. Yeah, maybe, maybe that will happen, you know? Called standard rating system. So, what it is, is you take the strength of schedule which is rated based on how the teams play against how well they do, how many points they score. So, you take this the strength of schedule and you compare it to the point differential, so that's the difference in points scored versus opponent's points, and then you can create this new statistic. And it was interesting when I was looking at it because the S-R-S related very, very similar to the ranking. So, your top ten teams were almost identically top in S-R-S as well. So, it's a good way if you're trying to guess who's going to make the tournament initially, as you can use a S-R-S is a good statistic, so I thought that was a good one to include in predicting who's going to win.

